
How to read presidential polls
Kevin Kim crunches the numbers
It’s almost that time.
On Nov. 8, 2016, we, as citizens of the United States, get to exercise our privilege to go to our local high school, walk behind the curtain and check the box next to the name of the person we feel is best fit to serve as commander-in-chief of the United States.
Before we do that though, as human beings who are curious by nature, we need to gather information. We track to see whose plan is best and whose policies will make the United States a better place.
And of course, as members of a result-oriented capitalist country, we want to check out which candidate is winning, and who is not.
We see the numbers.
We see the polls.
The numbers on the surface are not hard to read, but truly getting a grasp of this data does not come so easily. Here are some things to keep in mind as you indulge in the understanding of presidential polls.
1. Check the sourcing
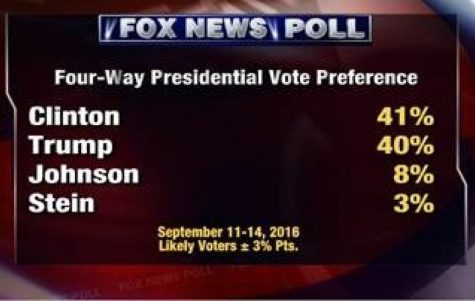
Each poll has its own method of gathering and analyzing the data it displays. Take this poll released by Fox News last week:
Seeing numbers next to a name can be satisfying. But satisfaction bears no meaning if we do not see how these votes were gathered.
By digging deeper into the source of the polling, one finds these numbers were gathered as a result of telephone interviews from a random sample of 1,000 likely voters.
That’s a small number of people to represent the more than 325 million U.S. citizens. Even more concerning is that the sampling may be altered by false representation.
How do pollsters know who is a “likely voter?” The categorization of “likely” is subjective and depends on the polling administrator’s definition of vote history and vote choice.
And the style of interview likely changes the results?
A study done by the Pew Research Center shows that individuals are more likely to try to be positive in phone interviews than on the web to create a positive interaction with the interviewer. This may skew the vote preferences one way or another, creating an inauthentic representation of voters.
2. Check the margin of error
Even if the sources are accurate, the numbers could be different than they seem.
Going back to the Fox News poll, we see the error margin is figured at plus or minus 3 percent. This means the true range of outcomes of the poll can have a difference of up to 6 percent.
Democratic nominee Hillary Clinton is polling at 41 percent in the Fox News poll. Margin included, she could come in as low as 38 percent or as high as 44 percent.
The difference is huge. Clinton could be up by seven percent or down by five.
When the variance for the data structure is this wide, concrete conclusions cannot readily be made. So if you want a solid grasp on the differences of data provided, look at the differences in the margin of error.
3. Assess all of the options
When calculating political polls, representation of all parties matter. When we go behind the curtain on November 8, the ballot will list many names.
It’s not just the two major party candidates ― Clinton and Donald J. Trump. Green party candidate Jill Stein, Libertarian candidate Gary Johnson and dozens of other candidates will be on the list, too.
It’s your responsibility to assess all the options, and it is the pollster’s responsibility to give voters all the options when setting up surveys and polls.
Of course, this doesn’t mean they should list every single candidate out.
Because the ballot will have third-party candidates listed, it only makes sense that polling would represent these candidates.
Believe it or not, third-party votes do matter. Young voters at a recent Jill Stein event in Northampton said they plan to cast a third-party vote rather than support Clinton or Trump.
Third-party supporters could split the vote, impacting who wins in November. Former presidential candidate Al Gore may have lost the election in 2000 because votes in some states were split between him and Green party candidate Ralph Nader.
RealClearPolitics explains this phenomenon in detail.
4. One poll is just that: One poll
Every singular poll, no matter how in-depth it may be, is inherently flawed.
When we create something flawed, we try our best to hide that fact. Everyone has a different defense mechanism to hide their flaws.
You might take a sip of your sparkling water to compensate for saying something weird in front of your boss, offer to cook breakfast when you realize you didn’t do the dishes or look away in embarrassment when you realize you broke your friend’s car mirror.
Polls also have defense mechanisms that account for their flaws, whether it be huge margins of error, faulty sampling or a lack of assessing the options. It is imperative you are aware of these flaws before making judgments on a poll.
To best offset these facts, check out aggregate polls such as FiveThirtyEight and the New York Times.
They forecast presidential elections with a large amount of data points rather than a singular poll.
According to the law of large numbers, as a sample size grows, the average of the entire sample size becomes close to the average of the entire population. Assessing the average from 100,000 points of data is more likely to be indicative of the population than just one.
These websites contain data gathered from many national and state polls, and thus will end up being more representative of the entire population.
You have the information. How you use it is your decision.
Email Kevin at [email protected] or follow him on Twitter @kevinkimlife.